


Crypto Market Update - Weekly Report.
Week 04 | 2025

Greetings, fam!
By popular demand, here's a detailed market update. For those encountering this type of market update for the first time, let me give you a quick overview: we analyze all market tickers, break down key insights, and finally conclude with actionable strategies for the current market conditions. Ideally, this would be presented through live streaming, but for now, this format works best. So, let’s dive right in:
$BTC Higher Time Frame (HTF) Analysis:
Over the past 107 days, BTC has consistently traded above a key trendline. Each time it touches this trendline support, we see quick and strong bounces. This trendline is currently aligned with the EMA50 on the daily chart, making it a critical level to sustain the bullish momentum in the higher time frame picture.
In addition to the trendline, I’ve highlighted three important red levels. For now, the update is straightforward:
As long as $BTC holds the 0.25 Box, we’re poised for upward movement.
If we lose that level, I’ll target the $95K level—simple as that!

$BTC Lower Time Frame (LTF) Analysis:
The LTF structure for $BTC currently appears bullish to me. Any small dip down to the 103.5K$ level should be considered a buying opportunity.
Personally, I’m in a scalp long position with:
A small entry at the current market price (CMP)
A second entry planned at the 103.5K$ level
Both positions are managed with a tight stop-loss (SL) and well-defined take-profit (TP) levels to minimize risk and maximize reward.
This setup aims to capitalize on the bullish momentum while keeping risk in check. Trade smart!

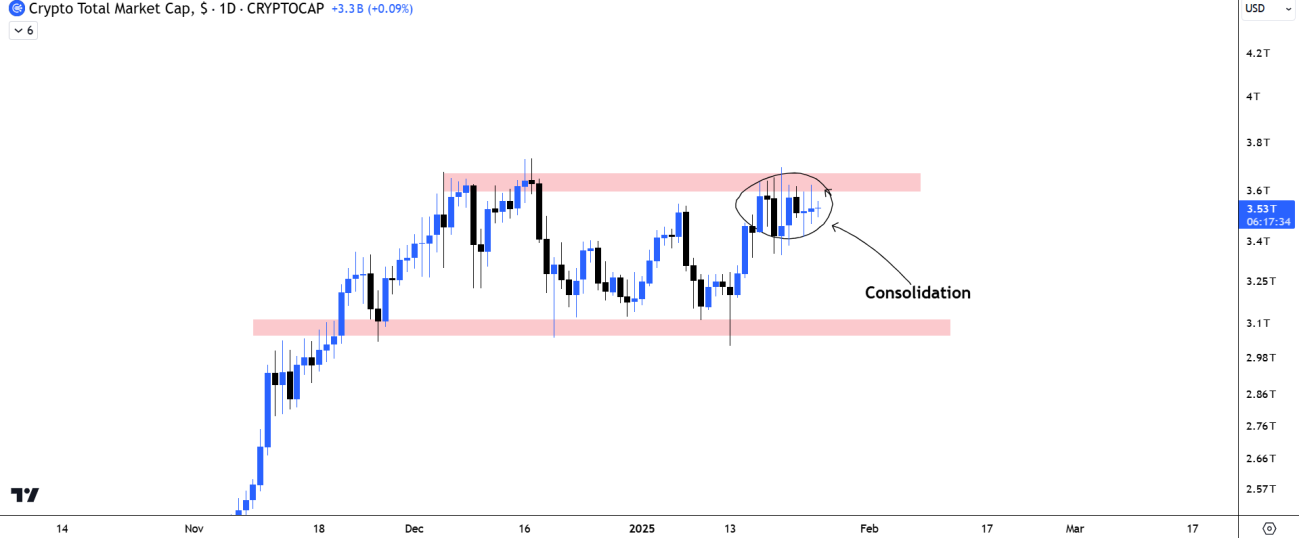
$TOTAL Market Analysis:
The $TOTAL, representing the total market capitalization of cryptocurrencies, has been trading within a range for the past 2–3 months.
Currently, the price action appears to be in a consolidation phase just below a key resistance level. Typically, the longer the consolidation under resistance, the more significant the breakout tends to be when it occurs.
In summary, keep an eye on this range. The prolonged consolidation hints at a potentially powerful move ahead—patience is key!
$TOTAL Lower Time Frame (LTF) Analysis:
$TOTAL is currently consolidating within a triangle pattern on the lower time frame. This type of structure often indicates an impending breakout.
A breakout on either side of the triangle will likely dictate the next significant move. It’s crucial to watch for volume confirmation when the breakout occurs to gauge its strength and direction.
Stay alert—this could set the tone for the broader market's next steps!

$TOTAL2 Market Analysis:
$TOTAL2, representing the total crypto market cap excluding Bitcoin, is looking quite interesting at the moment.
The important support is currently aligning with the 0.5 Fibonacci level and the EMA50, making it a critical area to watch.
If this level holds, we can expect an upward move soon.
However, if this support is lost, caution will be necessary as we could see a further drop toward the red box marked on the chart. That zone, however, would present an excellent buying opportunity for mid-term positions.
Stay focused on these levels to plan your next move!

$USDT.D Analysis:
USDT.D has formed a double top pattern and recently broke its trendline support, signaling a potential shift in momentum.
The 4% level is now acting as a significant resistance.
The 3.8% level serves as a key support to monitor closely.
A breakout on either side of these levels will be critical. Watch cautiously as the direction will provide valuable insights into the overall market sentiment and the potential next move.

$DXY Update:
The U.S. Dollar Index (DXY) often moves inversely to Bitcoin, making it a key indicator to watch.
Currently, DXY is sitting at a support level, so the next move will be crucial.
If it breaks down below this support, it could trigger a massive inflow of capital into Bitcoin, as dollar weakness typically strengthens the crypto market.
Keep a close eye on this level, as it will likely shape the broader market dynamics in the coming days!

BTC.D Update:
This chart is a textbook example of confluence, making it highly significant for analysis:
The 58% level is a key support, strengthened by three confluences aligning at this level. If BTC.D breaks below this support, it would create a favorable environment for altcoins to rally.
On the upside, the 0.75 Fibonacci level could act as a potential rejection zone, signaling a possible reversal or slowdown in dominance.
Monitor these levels closely, as they hold critical implications for the performance of altcoins relative to Bitcoin!

$ETH Update:
Ethereum ($ETH) is currently forming a strong structure, showing promising signs of a potential breakout.
A significant liquidity zone is building up above the trendline, which indicates that a breakout might be imminent.
In my opinion, this setup is worth keeping a close watch, as the breakout could lead to a decisive move.
Stay alert and ready to act when the move begins!

Market Summary:
I remain bullish on $BTC as long as it holds the key levels outlined in my analysis. My perspective will shift if these levels are lost, but for now, the bullish sentiment remains intact.
I’m also bullish on $ETH, with its current structure hinting at a breakout, and I see potential in specific altcoins that align with strong setups.
The focus is on maintaining flexibility while closely monitoring the market to adapt as conditions evolve. Let’s trade smart! 💹
patience on $ETH
Thank you!